EN
EN  PT-BR
PT-BR FR
FR ES
ES DE
DE


AI Summary
- AI generates documentation rapidly but can confidently present incorrect information; reviewing has become the bottleneck, requiring systematic evaluation at production speed.
- The framework evaluates four pillars: Trust (35%), Completeness (25%), Craft (25%), and Compliance (15%). Each uses measurable sub-metrics and specialized LLM layers.
- Trust extracts factual claims and verifies them against PRDs, API specs, human-written articles, and engineering docs using NLI, labeling claims supported, contradicted, or unverifiable.
- Raw pillar scores undergo pillar-specific Weibull CDF transformations and combine through a weighted geometric mean, preventing strong performance from hiding serious weaknesses. A zero pillar produces a zero composite.
- The system uses 14 sub-metrics, and its Weibull transform means even a flawless article reaches approximately 0.96 rather than 100%. Future work involves calibration against real-world editorial decisions.
AI-generated content. It may contain errors.
See Document360 in action
While creating documentation, a technical writer usually gathers information from Product Requirement Documents (PRDs), API specs, engineering documentation, and stakeholders. Then it is reviewed by another human before publication. The trust issue over the instant writing generated by AI is real, because AI can never perceive information like a human would. It is synthesized entirely from training data, and it can confidently present incorrect information as a fact. So how do we verify what an AI wrote?
The Bottleneck Has Moved From Writing to Reviewing
In about 30–40 seconds, AI can generate a 3000-word article on any topic. Meanwhile, a technical writer would take roughly 30 minutes to evaluate it thoroughly. At 20 articles per week, AI is done by Monday morning, while a reviewer is catching up until Friday. Here, one side of the pipeline is 50x faster, while the other hasn’t moved at all. The bottleneck has moved from writing to review.
So, what we exactly need is an evaluation framework that can evaluate AI-generated content systematically, at the speed it is produced.
Why Does Linear Scoring Fail?
Most of the evaluating frameworks today use LLM-as-a-judge and combine scores with a weighted average. A beautifully written article full of hallucinations can get strong scores, because its craft score offsets its trust score. But humans’ perception of quality doesn’t work that way. It is inspired by the Weber-Fechner law from psychophysics, which states that the difference between bad and decent matters more than the difference between good and great. But the weighted average of a linear model treats both cases equally.
So, a non-linear scoring framework is introduced, which addresses both problems. It evaluates every article across four major pillars:
- Trust – Is the content factually correct?
- Completeness – Does it cover everything it should?
- Craft – Is it well-written technical documentation?
- Compliance – Does it follow the organization’s terminology and style rules?
Rather than relying on a single judgement, each pillar is built from specific, measurable sub-metrics. The pillar scores are passed through a non-linear transform and combined with a weighted geometric mean, so that a serious failure in one area cannot be hidden by a strong performance in another.
The section below describes each pillar, followed by its scoring model.
Four Core Pillars of Our Eval Framework
1. Trust: Is the content factually correct? (35%)
Trust is the heaviest pillar. AI can generate a well-defined, structured paragraph about a product or API endpoint that doesn’t even exist. Things can be easily hallucinated using AI.
The trust pillar works by extracting every factual claim from the article and verifying each one of them against the source artefacts that are given (PRDs, API specs, human-written articles, engineering docs). It runs NLI (Natural Language Inference) on every claim and labels each as supported, contradicted, or unverifiable (if zero source documents make that claim).
Three sub-metrics make up the trust score:
- Faithfulness (50%): What % of the claims are supported by the sources?
- Non-contradiction (30%): The inverse contradiction rate. Even a single contradicted claim turns out to be a problem.
- Entity accuracy (20%): Are the terminologies used correctly? (including numbers, URLs, endpoints, version strings)
The rationale behind the 35% weight: Factual errors are the failure mode uniquely introduced by AI but consistently missed by humans. A typo is visible, but a hallucinated API endpoint is invisible. Trust carries the highest weight because it addresses a problem that didn’t exist before AI could generate content.
2. Completeness: Does it cover what it needs? (25%)
An AI article might look solid while lacking what is actually needed. It may have a clean introduction and a solid overview but give five steps out of seven. The two steps that get skipped? Usually the edge cases and error handling that matter in production.
Four sub-metrics under completeness:
- Topic coverage (45%): Did the article address every topic in the source material?
- Section coverage (20%): Does the article have the sections that the reader expects for this type of article?
- Source topic coverage (20%): If the source mentions 5 steps, are all 5 steps covered in the article?
- Template adherence (15%): Does the article follow the provided template?
3. Craft: Is it good technical writing, not just correct grammar? (25%)
The grammar in AI writing is nearly perfect and looks good on a high level. Most LLM-as-a-judge evaluators stop at “Is this grammatically correct?”. But the real craft failures are subtler, and this pillar catches them.
Six sub-metrics make up the craft score:
- Depth calibration (20%): Is the level of detail appropriate for the target audience?
- Stating the obvious (20%): Text that adds words without any information. For example, in a webhook setup article:
“Webhooks are a way for applications to send real-time notifications to other applications when certain events occur.”
If someone searched for “how to set up webhooks in Document360,” they already know the concept.
- Fluff detection (15%): Marketing language, meta commentary about the article itself, padding, and history that belongs in release notes, not in a how-to guide.
- Structure alignment (15%): Does the information follow a logical order, or does the article explain the advanced configuration before telling you how to install it?
- Information flow (15%): Does each section build on the previous one, or does the reader have to jump back and forth to understand?
- Voice and clarity (15%): Second person, active voice, concise sentences. The things style guides care about at the sentence level.
4. Compliance: Does it follow our terminology and style rules? (15%)
The compliance pillar is mostly deterministic. It runs regex-based checks against concrete rule sets like a terminology glossary, style guide, UI label registry, and jargon word lists.
Six sub-metrics under compliance:
- Terminology (34%): Across 50 AI-generated articles, you may find half of your docs calling it “team accounts”, whereas the other half call it “user accounts”. Checked against both regex and glossary documents (LLM-as-a-judge).
- UI labels (16%): Does the article say ‘Click “Save”‘ when the UI button actually says “Save”? This is checked against screenshots.
- Style guide compliance (16%): Deterministic style rules – serial commas, sentence case headings, etc.
- Style guide adherence (14%): Reads the style guide and checks if the article follows it.
- Jargon compliance (10%): Checks if the vocabulary used is appropriate for the target audience.
- Readability (10%): Average sentence length, Flesch-Kincaid grade level, passive voice percentage.
This carries the lowest weight (15%) because a terminology violation makes an article inconsistent, not wrong. This is comparatively less important than a hallucinated endpoint or a missing section.
Document360 helps you create, review and publish knowledge base content with AI built in.
Book a Demo
The Scoring Model: Why Not Just Average the Pillars?
Layer 1: Reshaping each pillar with a Weibull curve
Each pillar produces a raw score between 0 and 1, which is not used directly. Instead, it is passed through a Weibull CDF transformation.
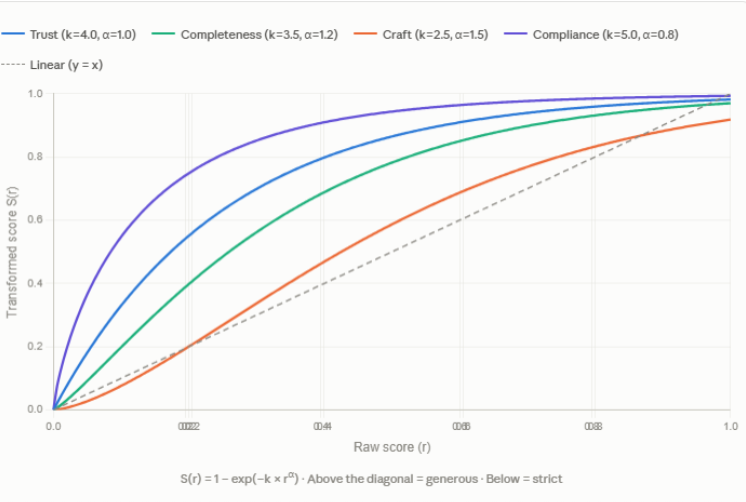
S(r) = 1 − exp(−k × rα)
Where k controls steepness and α controls curvature.
The transform reflects a fundamental asymmetry in the perception of quality. On the trust scale, the distance between 0.30 and 0.60 represents a far greater improvement than the distance between 0.80 and 0.95. Correcting 3 hallucinations has a greater impact than refining a single sentence.
The Weibull curve is steep at the low end (big score gains for fixing real problems) and flat at the high end (diminishing returns on polish). Each pillar gets its own k and α according to its nature.
- Trust (k=4.0, α=1.0): Nearly linear, as every hallucination matters equally.
- Completeness (k=3.5, α=1.2): Moderate diminishing returns.
- Craft (k=2.5, α=1.5): Strong diminishing returns, because perfect prose is usually subjective.
- Compliance (k=5.0, α=0.8): Like a step function. You either follow the rules or you don’t.
Layer 2: Combining pillars with a weighted geometric mean
Once we have the transformed scores, we combine them into a composite score per article. Here we use a weighted geometric mean instead of a weighted average.
Composite score = ∏ (Siwi)
Where ∑ wi = 1, and Si is the transformed score of each pillar.
A composite score is just a triage signal of the article’s overall quality.
The difference is what happens when one pillar is near zero. In an arithmetic mean, 0.95 in craft can compensate for 0.20 in trust. The composite score might land at 0.65, which looks passable. In a geometric mean, a single weak dimension drags the entire score down. A zero in any pillar means a zero composite. Period.
The intended behavior is that a beautifully written, perfectly structured, fully compliant article which hallucinates its facts should not pass.
Why Not Just Ask an LLM to Rate the Article?
When you ask an LLM to rate an article on a scale from 0 to 1, the resulting distribution looks like this:
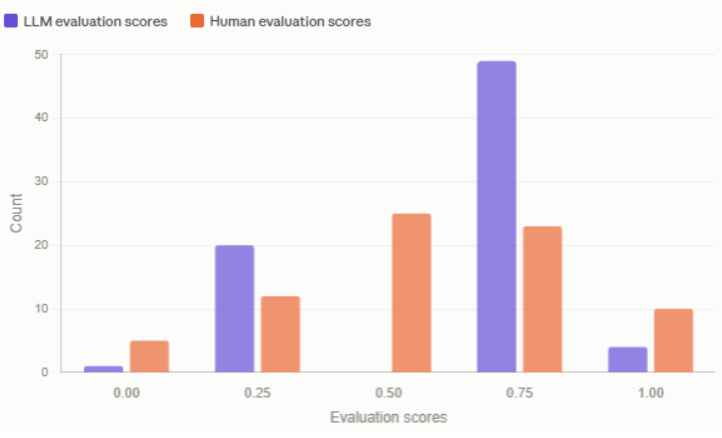
It’s a bimodal clustering problem: scores mostly land on 0.25 and 0.75. The fix is not a better prompt, but the decomposition of tasks. That’s why we introduced four pillars and multiple LLM layers.
Instead of asking one LLM “Is this article good?”, we break the question into 14 sub-metrics across 4 pillars. Each sub-metric measures something specific and independently variable.
Faithfulness is not an opinion. It is calculated as:
Faithfulness = supported claims ÷ total claims
Section coverage isn’t a judgment call; it’s:
Section coverage = present sections ÷ required sections
Specialized LLM layers used
We run multiple specialized LLM layers, each answering a narrow question.
- Claim extraction layer: Pulls every factual, procedural, and entity claim from the article.
- NLI verification layer: The Natural Language Inference layer takes each extracted claim and verifies it against the source artefacts used to write the article.
- Craft judging layer: Evaluates depth calibration, information flow, and structure alignment, which genuinely need subjective judgement.
- Style guide layer: Reads the compiled style guides and judges adherence, which splits the deterministic and judgmental checks.
Why No Article Scores 100%, by Design
The Weibull transform approaches 1 but never reaches it. Even a flawless article maxes out at a composite of approximately 0.96. That’s not a bug. That’s a ceiling through which the system tells you that no article can be perfect, because quality differs from reader to reader.
What’s Next
We are living in an era of content generation. The era of evaluation has just started. Every organization that adopts AI for documentation faces the same bottleneck: verification is way slower than writing. Evaluation models that reflect how quality actually breaks are required to bridge that gap.
Now that the math exists, what comes next is calibration against real-world editorial decisions at scale, a problem worth solving.